TOTAL VOLUME:
$150.1b
24H VOL:
$142,857,652
24H TRANSACTIONS:
2,859,322,643
OPEN INTEREST:
$1,733,278,615
483,990
Markets across
35,811
events
MATCHED EVENTS:
3,349
PLATFORM COVERAGE:
5
Polymarket:
38%
VS.
Kalshi:
62%

Above 4.1 million
- Kalshi
Above 4.1 million - Kalshi
1W
News
Positive
Negative
Neutral
Hover marker for details
Vol.
·
Resolves Feb 8, 2027
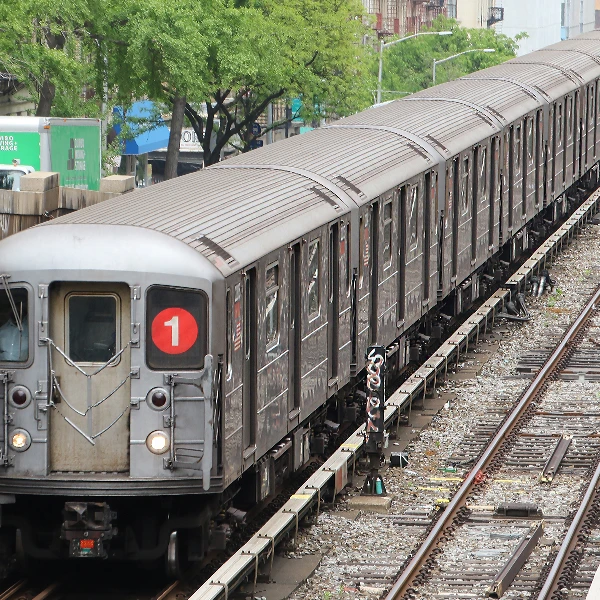
Will NYC subway average weekday ridership (the mean of the MTA's daily subway ridership figures for every Monday through Friday, holidays included) as published in its Daily Ridership and Traffic series be above 4100000 in October 2026?
$
Description
This event tracks New York City's subway system usage by measuring the average number of riders each weekday in October 2026. The outcome depends on whether the ridership exceeds specific thresholds set by the Metropolitan Transportation Authority. It reflects public transportation trends and commuter behavior over a defined period.
Kalshi
The event resolves based on the New York City subway’s average weekday ridership for October 2026, as reported by the MTA in its Daily Ridership and Traffic series. The average is calculated using the mean of daily subway ridership figures for all Mondays through Fridays in that month, including holidays. Multiple markets correspond to different ridership thresholds (above 4.1 million, above 4.2 million, above 4.3 million, above 4.4 million, and above 4.5 million). The market with the highest threshold that is met resolves as 'Yes,' while all others resolve as 'No.' If none of the thresholds are met, all markets resolve as 'No.'
Frequently asked questions
On Kalshi, prices reflect that venue's order book, liquidity, and how traders price the outcome right now. On Kalshi, traders determine prices through continuous bidding and asking, reflecting their collective expectation of average weekday ridership in October 2026. The top outcome’s implied probability is shown as 99.0%, while volume of $331,421 indicates overall market activity. Price fluctuations respond quickly to new ridership data, policy announcements, or broader economic signals.
This market resolves around Feb 8, 2027, with the outcome confirmed once the event is verifiable from credible public reporting. Official transit statistics released by New York City authorities will serve as the reference point, ensuring an objective and transparent determination of the final ridership figure for October 2026.
Several signals could shift expectations in this market before it settles. These include major policy decisions affecting public transit, significant infrastructure projects, changes in urban employment patterns, or unexpected events such as strikes or large-scale public health issues. Each of these factors may cause traders to adjust their bids and asks, thereby moving the market price toward new levels as new information emerges.


